Mapping hours of direct sunlight (HDS) data
When and where will the sun shine?
Whether you are looking at cities or regions with rugged landscapes, knowing exactly when the sun will appear or disappear and how much direct sunlight a location will receive can be relevant not only for our day to day life but also for a wide variety of domains such as real estate, road safety, solar energy, agriculture, hospitality or even photography.
Daylight as opposed to direct sunlight
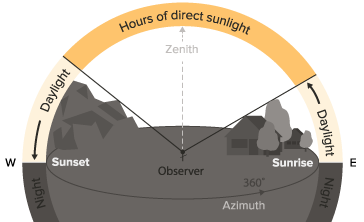
Daylight is given from the interval between sunrise and sunset at a specific location on Earth. Hours of daylight through the year are calculated using the relative position of the sun defined by the azimuth and zenith angles, from a point of observation at a given longitude, latitude and altitude.
However, in the case of rugged landscapes (hills, mountains) or urban environments (buildings), daylight hours will not necessarily reflect the total number of hours of direct sunlight (HDS) that the observer will receive in a day. HDS data is much more complex to obtain and must be derived from volumetric projections of local topographic features and physical objects such as buildings and trees.
Building shade maps
We have developed an algorithm that generates a Boolean grid (sun / no sun) at a given time of the day using topographic raster grids. The model computes and stores the 360 degree horizon line for every raster cell. The horizon raster dataset is then compared with the sun’s azimuth and zenith at a specific time to determine areas of direct sunlight or shade. By querying horizon raster grids, we can quickly estimate the volumetric projection of buildings, trees or hills and animate in time the path of shades over horizontal surfaces.
Instant shade through the day (5am to 10pm) in Wellington City at the winter solstice (21st June, left) and summer solstice (21st December, right)
We took the example of Wellington City for which we built two data elevation models (DEM) at resolutions of 5m and 1m. The DEM was built using a 1m resolution digital elevation dataset (Wellington City 1m Digital Elevation Model, Wellington City Council) combined with polygons of building footprints (Wellington City Building Footprints, Wellington City Council). The original 1m DEM raster cells contained in each polygon where set to the building footprint’s own elevation. Therefore this example considers buildings as square blocks. Finer topographic data from LiDAR surveys for example could show a significant difference from this study case.
Statistical analysis of HDS data
As this method provides a fast way to query surfaces of instant shade, we can easily compile and analyse different timeframes and extract relevant HDS data. In the interactive map of Wellington City, we show yearly average HDS data per day in Wellington. The map depicts the area that receives on average the largest amount of direct sunlight through the day in white and the fewer amount in dark. The data clearly shows how very little sun the business district streets receive in a day and highlight which buildings and residential neighbourhoods receives the largest amount of sunlight. Meteorology and particularly cloud cover data is not considered for this exercise and therefore the map represents the average HDS for a sunny day. A breakdown of HDS data before and after 12pm also tells us where are the places in Wellington that get most of the morning sun and those which rather receive afternoon sun.
Since the sun’s trajectory and the duration of each day change through the year, it is also quite relevant to compare HDS data through different seasons. Below, we show the average daily HDS for the month of June (shortest days) and December (longest days) over Wellington. In addition to highlighting the large difference in daylight hours between the two solstice months, the maps clearly show how the general sun’s orientation and zenith range through the year has an impact on total HDS for hill sides. For the larger Wellington city area (5m resolution grid), more than 10% of the total surface would receive less than 3h of direct sunlight per day in June, as opposed to 0.1% in December.
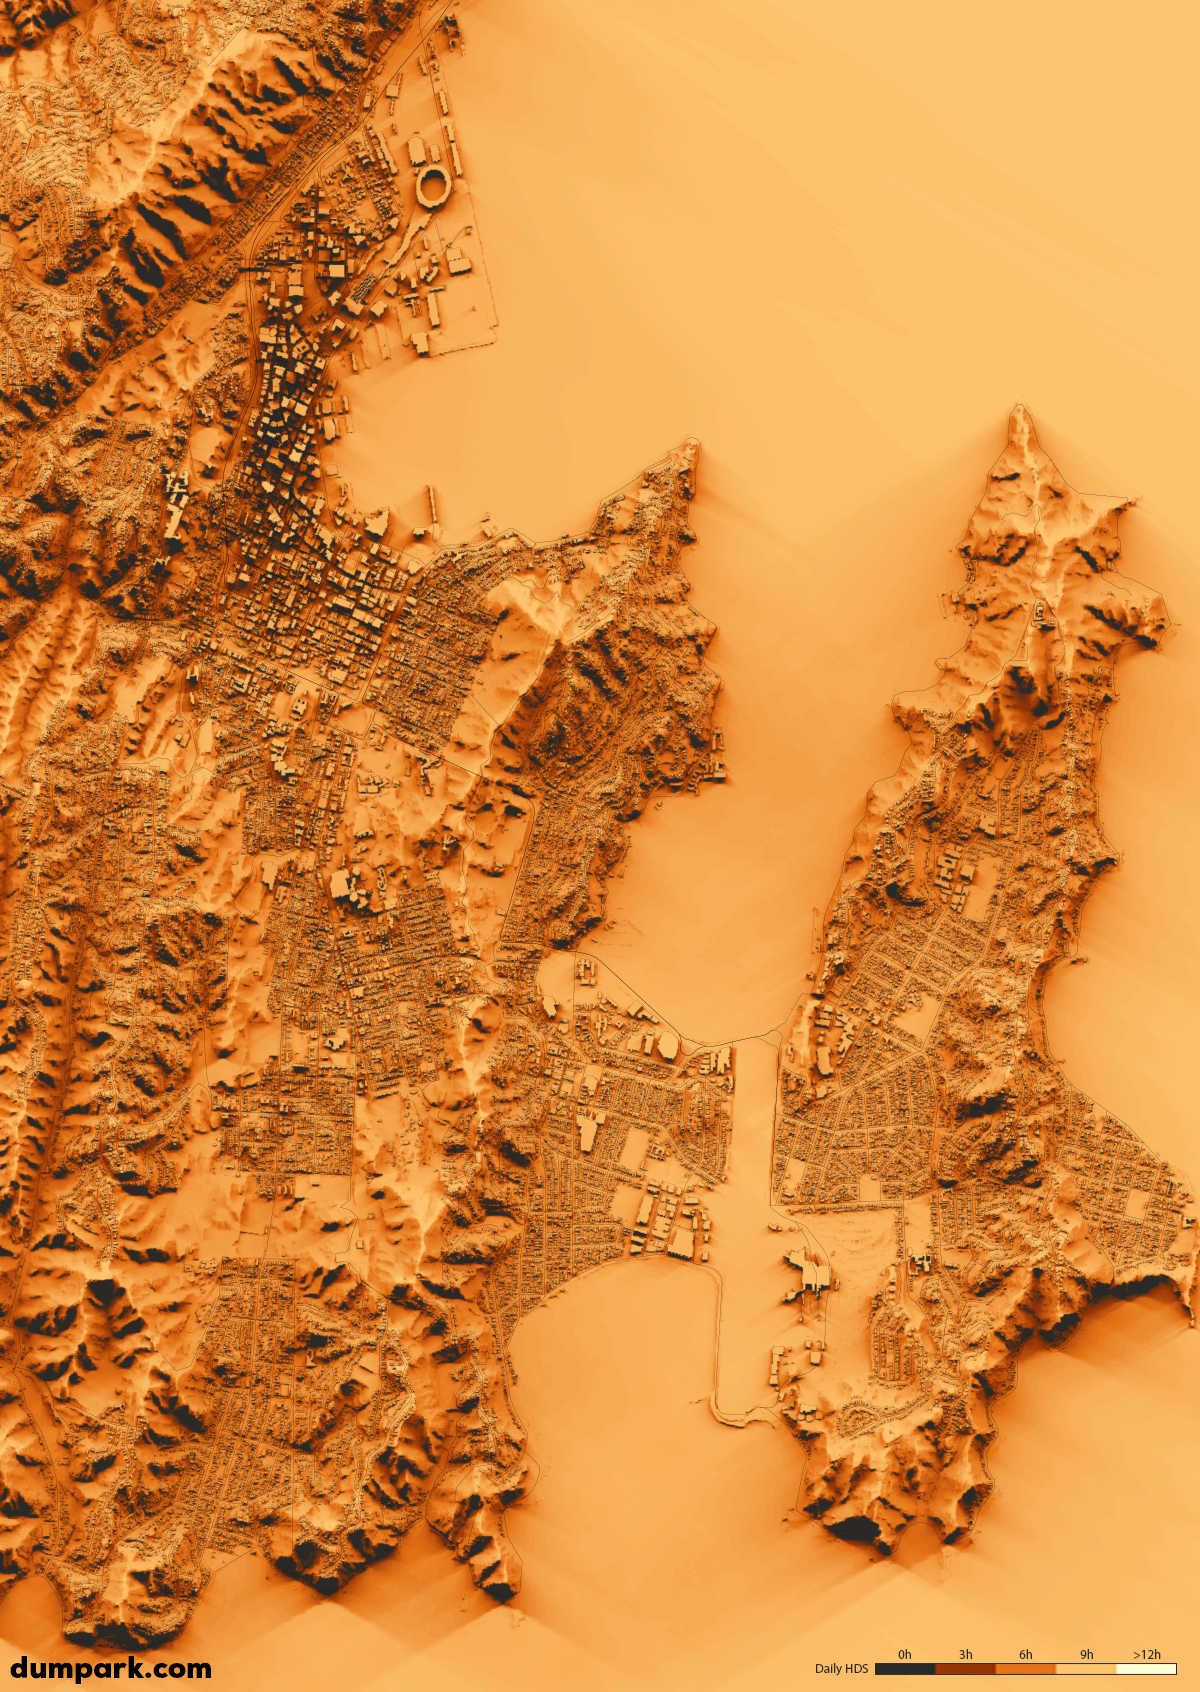
Average daily HDS in June (shortest days of the year), Wellington City
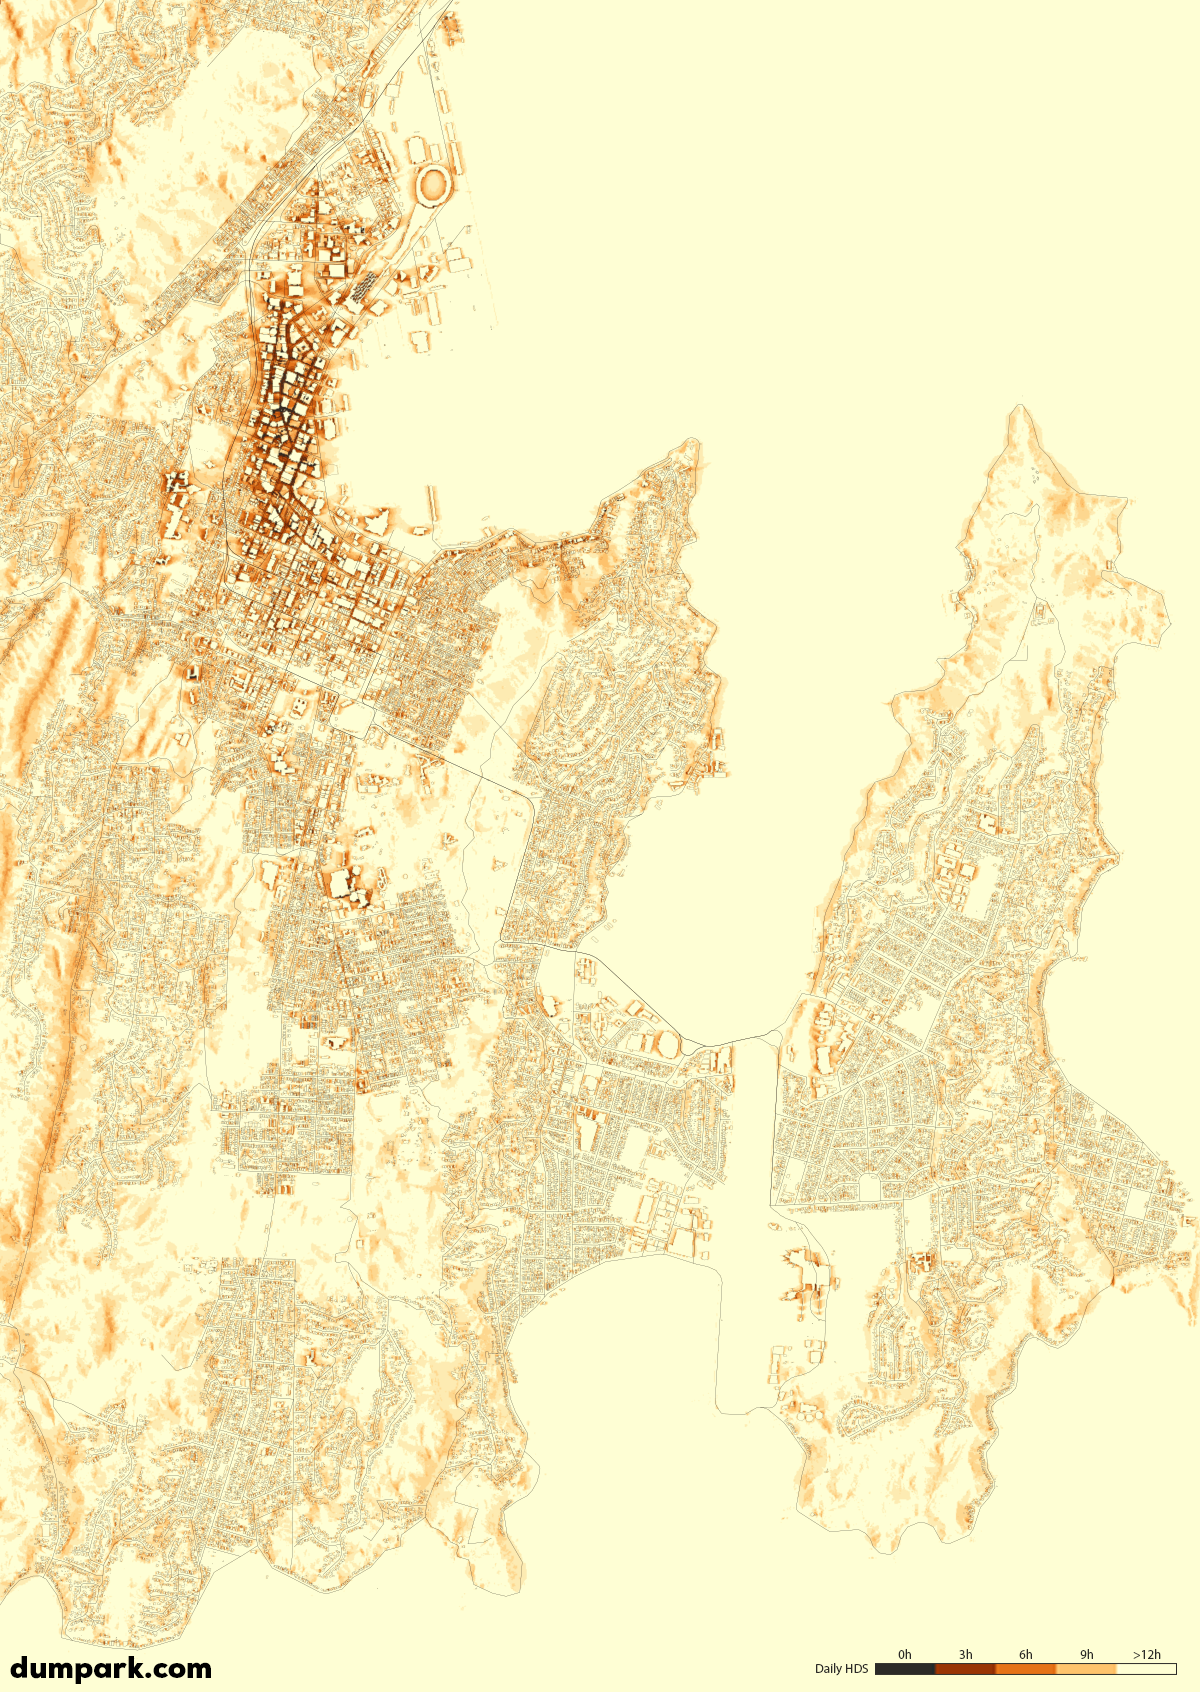
Average daily HDS in December (longest days of the year), Wellington City
Study case: Cuba and Manners Streets
The analysis of HDS data can also be assessed at a street level. We took the example of Cuba Street and Manners Street. For Cuba Street, HDS data was extracted from the upper part (South) at the intersection with Webb Street down to lower Cuba Street (North). For Manners Street, we extracted HDS data from the intersection with Willis Street (West) to Courtenay Place (East). The line charts below depict the daily HDS for the months of June (grey) and December (Yellow) for Cuba Street (top) and Manners Street / Courtenay Place (bottom).
It is interesting to note that despite the overall change of daylight between the two months, the total daily HDS for both streets do not significantly vary between summer and winter months.
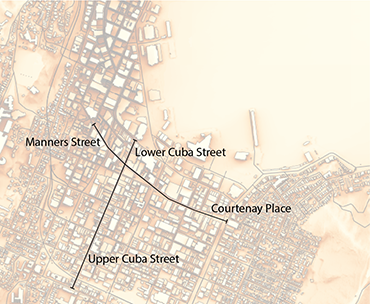
The amount of direct sunlight is mostly dictated by the buildings height within each street. The intersection with perpendicular streets are clearly visible and the impact of higher buildings (e.g. lower Cuba Street vs upper Cuba Street) or greater street width (e.g. Manners Street vs Courtenay place) is significant.

Average daily HDS in Cuba Street for the month of June (in grey) and December (in yellow)

Average daily HDS in Manners Street-Courtenay Place for the month of June (in grey) and December (in yellow)
Study case: daily variation at Oriental Bay, Victoria University and Civic Square
The database allows us to extract HDS data at finer scale for any location within the map. Here we extracted information for three iconic locations in Wellington City: Oriental Bay, Victoria University and Civic square. We asked the database when would the sun hit each spot through the day, everyday of the year and produced the following area charts. The vertical axis represents the hours of the day from 0:00 (bottom) to 23:59 (top) and the horizontal axis represents the day of the year from January to December. The area in yellow shows when the location receives direct sunlight while the area in light grey shows when it is shaded from obstacles. The dark grey area represents night time. The shift in hours from September to April corresponds to daylight saving.
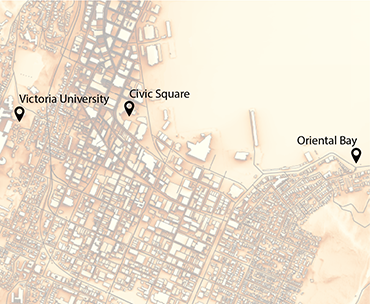
While Victoria University will get the sunrise from the far horizon all year long, it is only in winter that the north facing beach at Oriental Bay will be hit by the first rays of daylight. Oriental Bay receives most of the daily sun through the year but is rapidly shaded at sunset during summer, whereas the sun will not shine on a large part of Civic Square for at least two months during winter. Also interesting to note the shadow of surrounding buildings in Victoria University that temporarily interrupt the direct sunlight, in the morning, at the peak of winter.


